Building Your Own NAS: Monitoring
09 Mar 2026 [Blog SysAdmin Linux NAS Monitoring 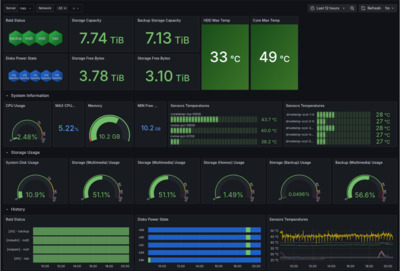
A NAS running unattended needs good monitoring. This part covers setting up comprehensive monitoring with email notifications, a full metrics stack (Telegraf + InfluxDB + Grafana), disk health monitoring, and RAID/ZFS alerting.
This is part 4 of the “Building Your Own NAS” series, originally published on root.cz. S1: Hardware & OS · S2: Custom Case & Data Migration · S3: Service Configuration · S4: Monitoring · S5: Security & Firewall
Most of what’s covered here applies not just to NAS but to any self-hosted server environment.
Email Notifications via Postfix
Email is the primary alert mechanism — everyone has email, and most system services automatically notify administrators about disk array, service, or security problems via email.
Installation
apt install postfix mailutils
During installation, select “Satellite system” to relay mail through an external server.
/etc/postfix/main.cf settings
Key parameters:
relayhost = [smtp.gmail.com]:587
myhostname = nas.yourdomain.tld
smtp_sasl_auth_enable = yes
smtp_sasl_security_options = noanonymous
smtp_sasl_password_maps = hash:/etc/postfix/sasl_password
smtp_tls_security_level = encrypt
smtp_tls_CAfile = /etc/ssl/certs/ca-certificates.crt
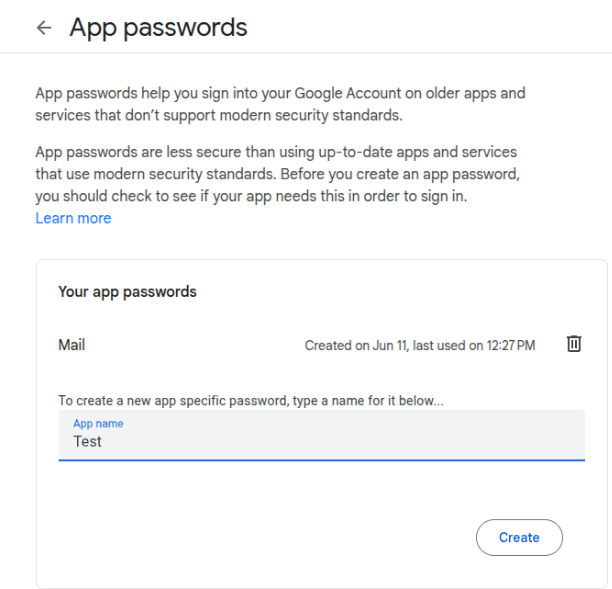
Use a dedicated Gmail account for NAS notifications and create a Google App Password — standard OAuth is not supported by Postfix.
Create /etc/postfix/sasl_password:
[smtp.gmail.com]:587 your-nas-account@gmail.com:app-password-here
Convert to database format:
postmap /etc/postfix/sasl_password
chmod 600 /etc/postfix/sasl_password /etc/postfix/sasl_password.db
Header Modifications
Create /etc/postfix/header_check to:
- Replace the sender address with your Gmail account
- Add
[nas]prefix to subject lines - Redirect all emails (including root’s mail) to your admin mailbox
/^From:.*/ REPLACE From: nas-notifications@gmail.com
/^Subject:/ PREPEND Subject: [nas]
/^To: root/ REPLACE To: your-real-email@example.com
Reference it in main.cf:
header_checks = regexp:/etc/postfix/header_check
Test email delivery:
echo "Test message" | mail -s "Test" root
Metrics Stack: Telegraf + InfluxDB + Grafana
Architecture
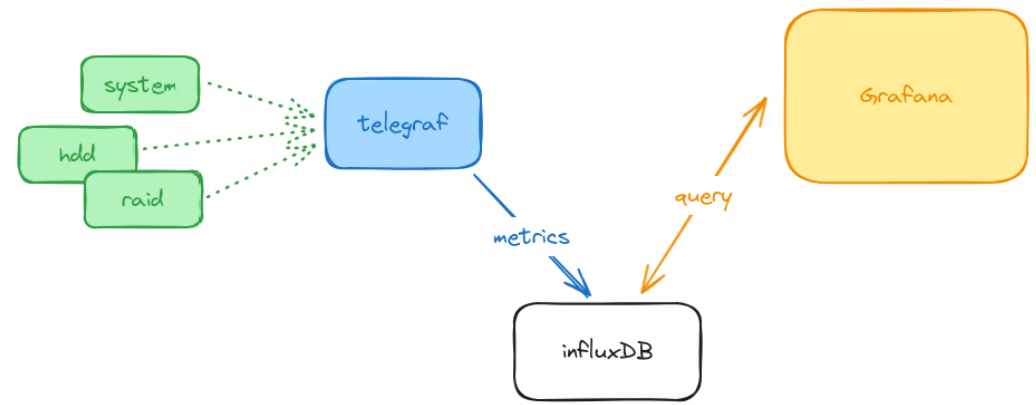
| Component | Role |
|---|---|
| Telegraf | Collects system metrics |
| InfluxDB | Stores time-series data |
| Grafana | Visualizes performance dashboards |
Telegraf Configuration
Key input plugins:
[agent]
  interval = "10s"

[[inputs.cpu]]
[[inputs.disk]]
[[inputs.mem]]
[[inputs.net]]
[[inputs.docker]]
[[inputs.zfs]]
[[inputs.sensors]]
Custom scripts track RAID status and disk power states via inputs.exec plugins:
[[inputs.exec]]
  commands = ["/usr/local/bin/check-raid-status.sh"]
  timeout = "5s"
  data_format = "influx"

[[inputs.exec]]
  commands = ["/usr/local/bin/check-disk-power.sh"]
  timeout = "5s"
  data_format = "influx"
Important: Define a meaningful data retention policy in InfluxDB to avoid unbounded disk growth. Set it during initial InfluxDB setup.
Note: Telegraf must run as root to access sensor data.
InfluxDB and Grafana
Both are deployed as Docker containers (see the services article for the deployment pattern). InfluxDB stores all time-series data from Telegraf. Grafana connects to InfluxDB and provides dashboards showing:
- CPU, memory, and storage utilization
- Disk temperatures and sensor readings
- RAID/ZFS health status over time
- Docker container resource usage
- Disk power state history — how many times per day each disk woke up
Temperature and Hardware Monitoring
lm-sensors Setup
apt install smartmontools lm-sensors
sensors-detect
Run sensors-detect to identify available hardware sensors automatically.
Add the drivetemp module for disk temperature readings:
echo "drivetemp" >> /etc/modules
modprobe drivetemp
After loading, disk temperatures appear in sensors output and Telegraf picks them up automatically via inputs.sensors.
Disk Health Monitoring with smartmontools
/etc/smartd.conf configuration
# NVMe system drives
/dev/nvme0 -a -m root
/dev/nvme1 -a -m root

# Data disks
/dev/sda -a -o on -S on -s S/../.././02 -W 5,40,50 -m root
/dev/sdb -a -o on -S on -s S/../.././02 -W 5,40,50 -m root
/dev/sdc -a -o on -S on -s S/../.././02 -W 5,40,50 -m root
/dev/sdd -a -o on -S on -s S/../.././02 -W 5,40,50 -m root
Key options explained:
| Option | Meaning |
|---|---|
-a |
Monitor all attributes |
-o on |
Enable automatic offline testing |
-S on |
Enable attribute autosave |
-s S/../.././02 |
Schedule short self-test daily at 2 AM |
-W 5,40,50 |
Temperature thresholds: difference=5°C, warning=40°C, critical=50°C |
-m root |
Email alerts to root |
Enable and start:
systemctl enable smartd
systemctl start smartd
RAID Array Monitoring
mdadm
mdadm automatically sends notifications to root when array problems occur. Since Postfix is configured to redirect root’s mail to the administrator, these alerts arrive automatically.
Verify mdadm email configuration in /etc/mdadm/mdadm.conf:
MAILADDR root
ZFS
Ensure the zfs-zed service is active:
systemctl enable zfs-zed
systemctl start zfs-zed
zfs-zed (ZFS Event Daemon) monitors pool events and sends notifications about pool issues, scrub results, and disk failures. Configure the recipient in /etc/zfs/zed.d/zed.rc:
ZED_EMAIL_ADDR="root"
ZED_EMAIL_PROG="mail"
ZED_NOTIFY_VERBOSE=0
Disk Power State Monitoring
One of the most useful custom metrics is tracking how often disks wake from standby. Drive longevity is affected by spin-up cycles, so minimizing unnecessary wake-ups is important.
A custom shell script for Telegraf’s inputs.exec checks whether each disk is in active or standby state using hdparm -C:
#!/bin/bash
for disk in sda sdb sdc sdd; do
    state=$(hdparm -C /dev/$disk 2>/dev/null | grep -oP '(?<=drive state is:  ).*')
    if [ "$state" = "standby" ]; then
        echo "disk_power_state,disk=$disk value=0"
    else
        echo "disk_power_state,disk=$disk value=1"
    fi
done
Telegraf runs this at the configured interval and stores results in InfluxDB. Grafana then shows a timeline of exactly how many times per day each disk woke up.
Grafana Dashboard Overview
The dashboard is organized into panels:
- System overview — CPU, RAM, network throughput
- ZFS pool — capacity, used/free space, I/O rates
- Disk temperatures — per-disk temperature graphs
- RAID/ZFS health — status indicator over time
- Docker containers — per-container CPU and memory
- Disk power states — timeline showing active vs. standby periods
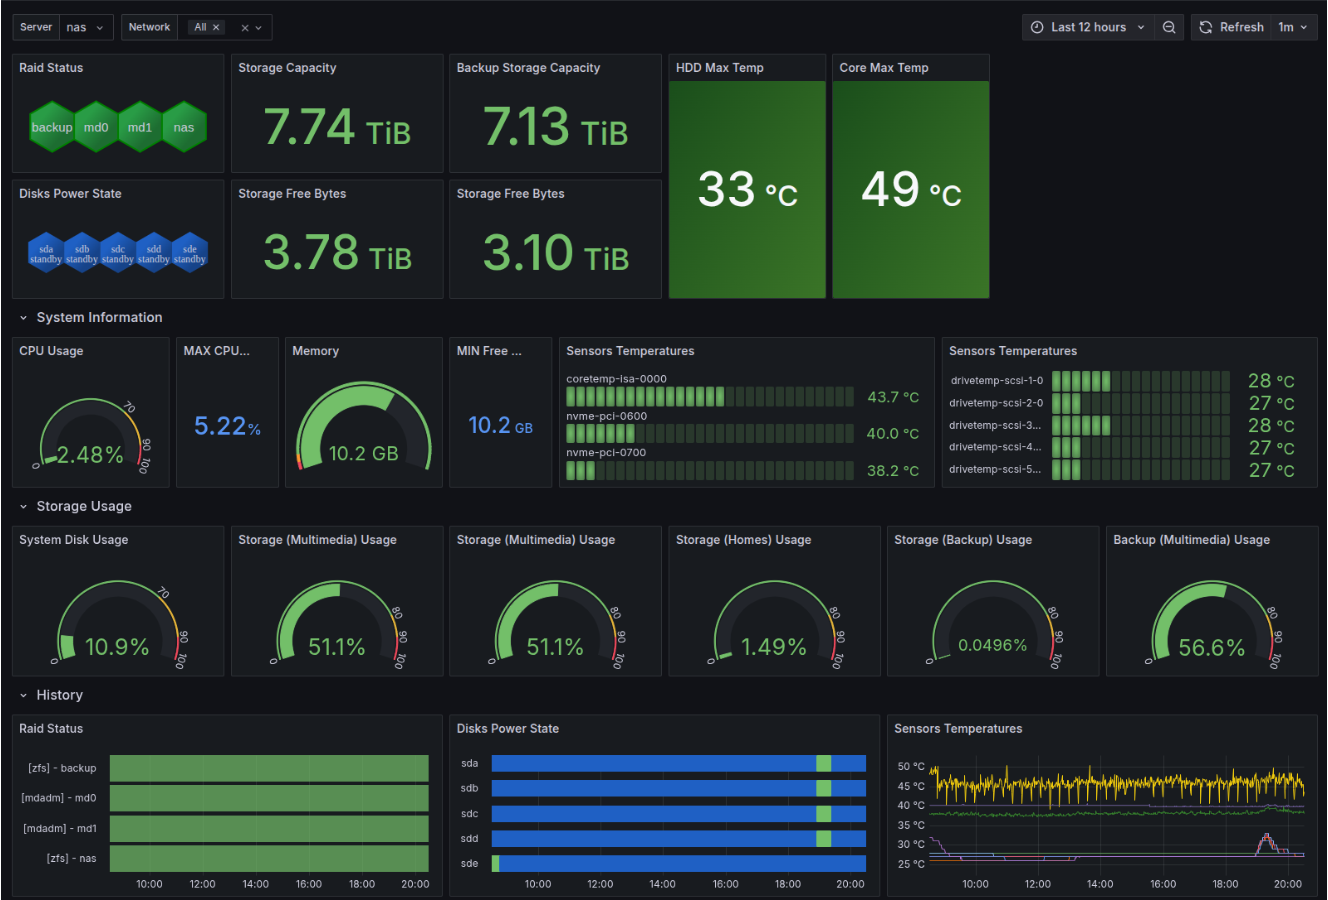
The dashboard gives a quick overview of the NAS state — temperatures, CPU and memory usage, and panels like Timeline RAID Status or Disk Power State. The power state view is particularly interesting: in the last 12 hours the disks woke up only once — for 20 minutes — which is exactly what we want.
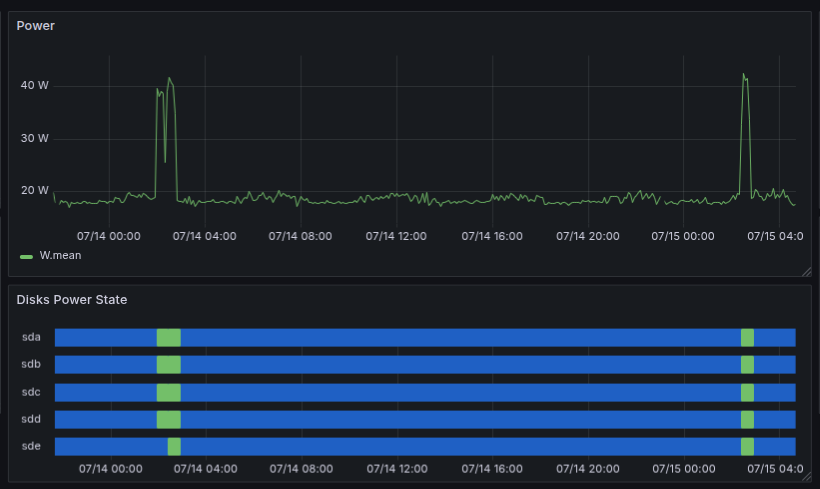 Power consumption in normal state and during transition from standby
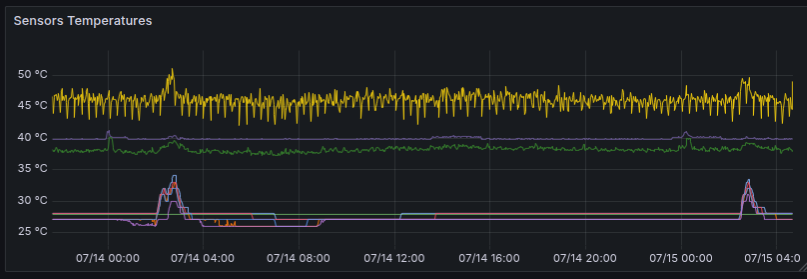 Temperatures of individual components
All configuration files and monitoring scripts are available in the GitHub repository.
Next: Security
In the final chapter, we’ll harden the NAS with automatic updates, SSH configuration, UFW firewall, and Fail2Ban protection.